

Gardner 2026 World Machine Tool Survey
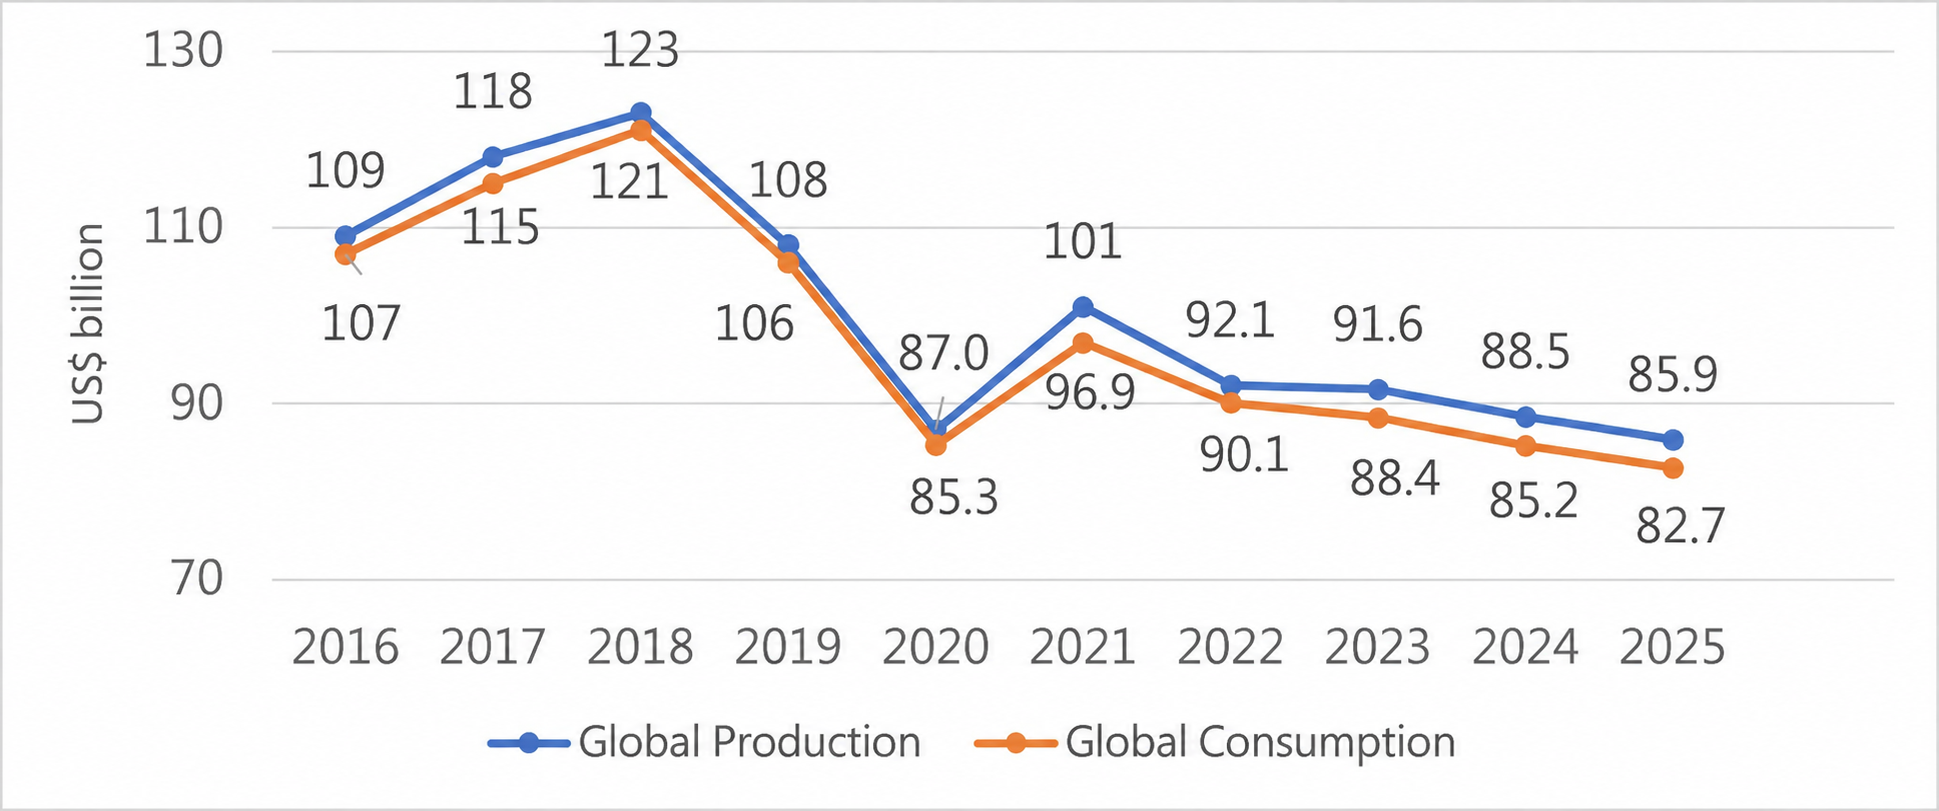
Global machine tool production and consumption both declined by approximately 3% in 2025. Although the decrease was modest, the downturn extended across nearly the entire world, with only a few markets recording growth.
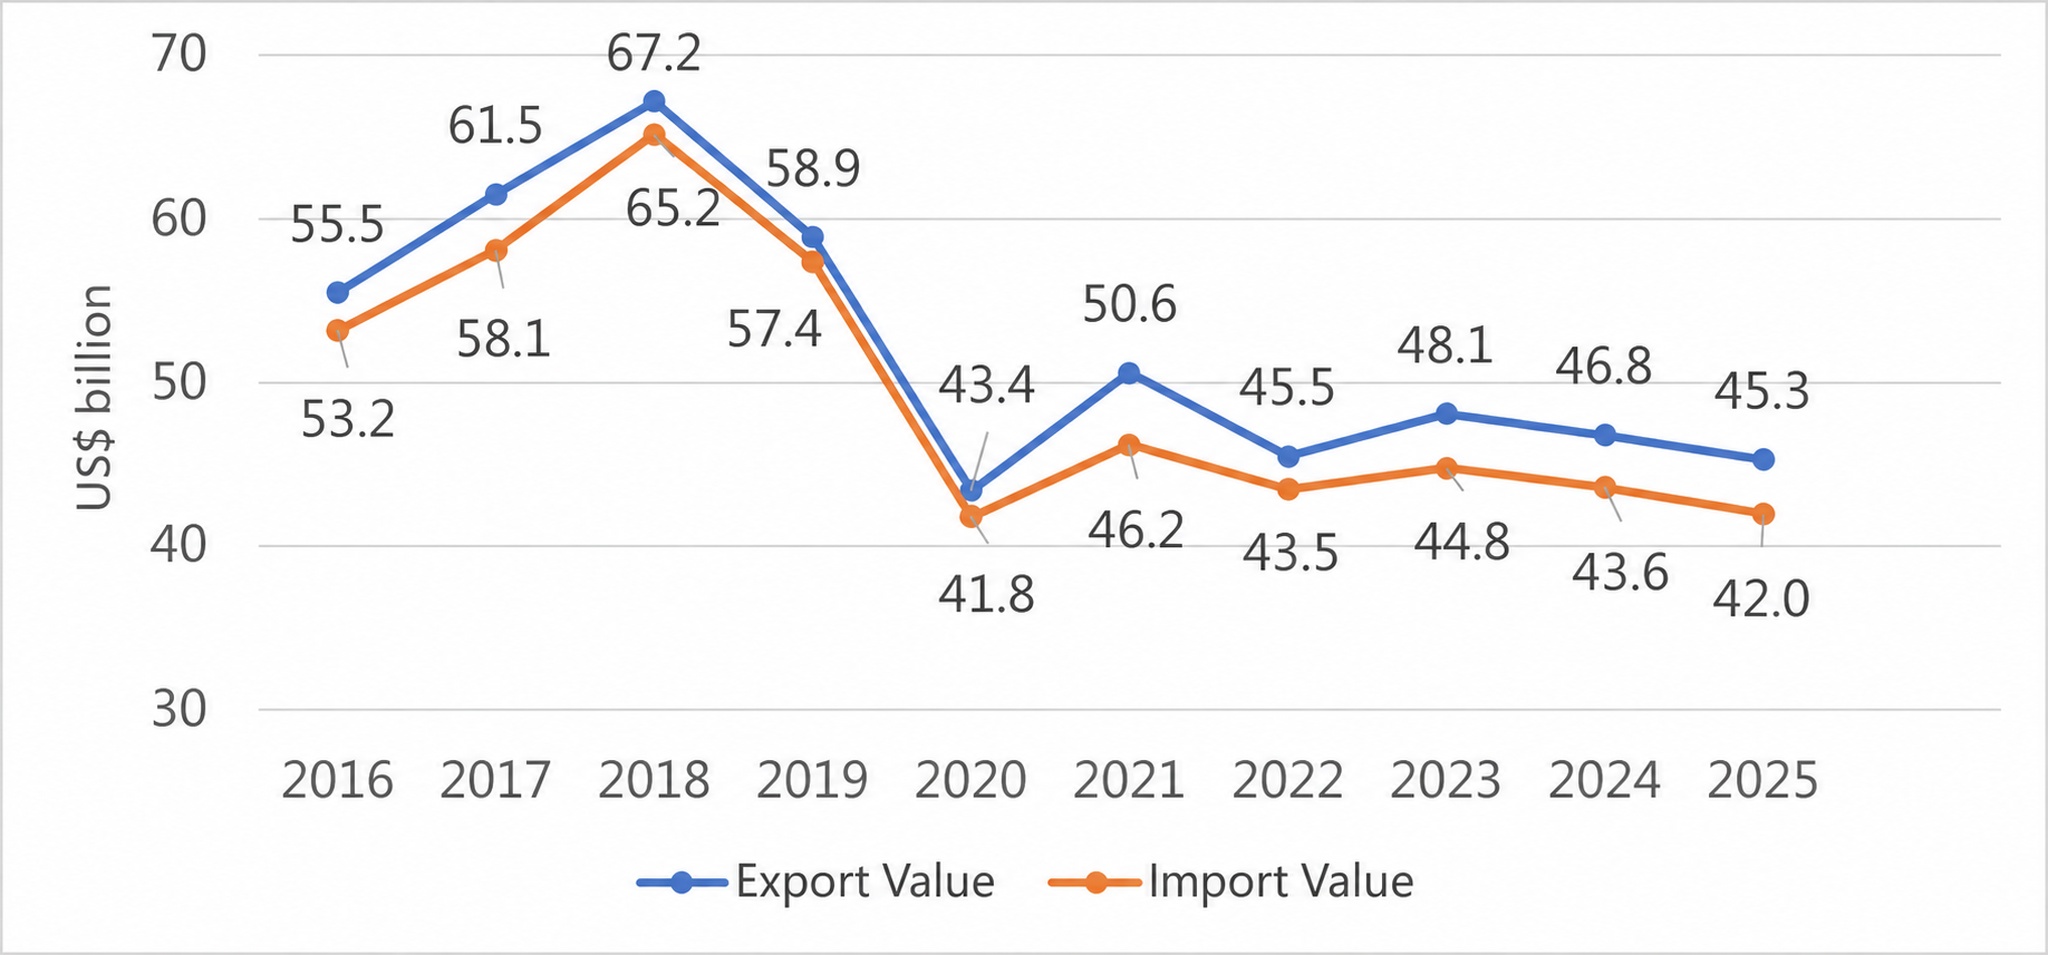
The global machine tool market softened in 2025 but did not experience a sharp contraction. Across the 54 countries covered by this report, total production was US$86.0 billion and total consumption was US$82.7 billion, both down about 3%. Imports totaled US$42.0 billion and exports US$45.3 billion, declining by roughly 4% and 3%, respectively.
More important than the size of the decline was its distribution. Of the 54 countries surveyed, machine tool consumption fell in 33, increased in 20, and was unchanged in one. The ten largest consuming countries, together accounting for 76% of global consumption, posted an overall decline of 2%, while consumption in the remaining 44 countries fell by 5%. This was not a case in which only the major markets absorbed the shock while others were spared, or vice versa. Demand cooled broadly around the world—with somewhat larger declines in mid-sized markets—and only a few regions achieved notable growth.
In addition, global machine tool production once again exceeded consumption in 2025, by US$3.2 billion, indicating that manufacturers’ shipments and capacity surpassed the market’s actual absorption.
Global Machine Tool Production and Consumption in 2025
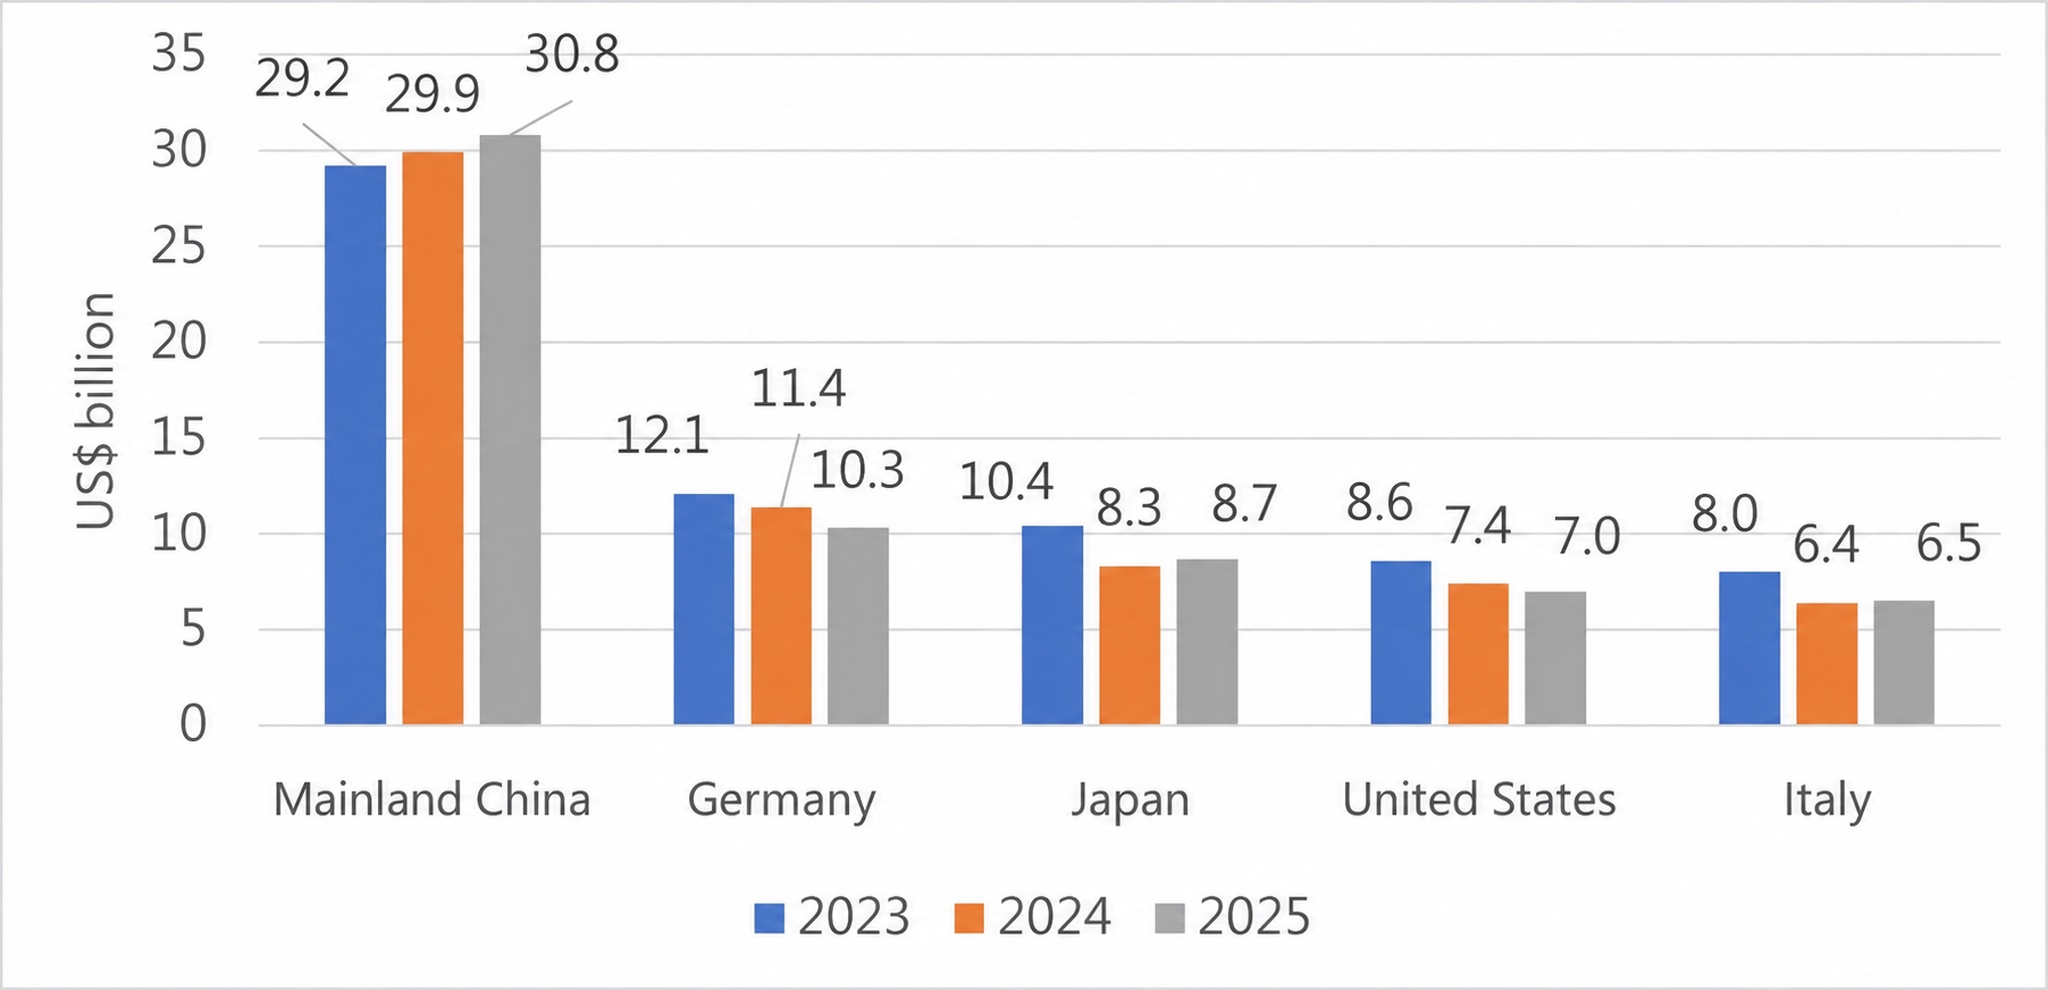
The ranking of the world’s ten largest machine tool producers was unchanged from 2024. Mainland China led by a wide margin with production of US$30.8 billion, followed by Germany (US$10.3 billion), Japan (US$8.7 billion), the United States (US$7.0 billion), Italy (US$6.5 billion), South Korea (US$4.4 billion), Taiwan (US$2.8 billion), Switzerland (US$2.4 billion), India (US$1.8 billion), and Spain (US$1.6 billion). Austria ranked 11th at US$1.4 billion, followed by Türkiye (US$1.0 billion) and France (US$0.9 billion).
The apparently stable rankings concealed significant differences. Among the top ten, only mainland China (+3%), Japan (+5%), and Italy (+1%) achieved production growth, while India was flat. Production fell in the other six countries, with the largest declines occurring in export-dependent economies: Switzerland fell 17%, Taiwan 12%, and South Korea 10%. Mainland China now accounts for 36% of the total production covered by the survey, exceeding the combined output of the next two producers.
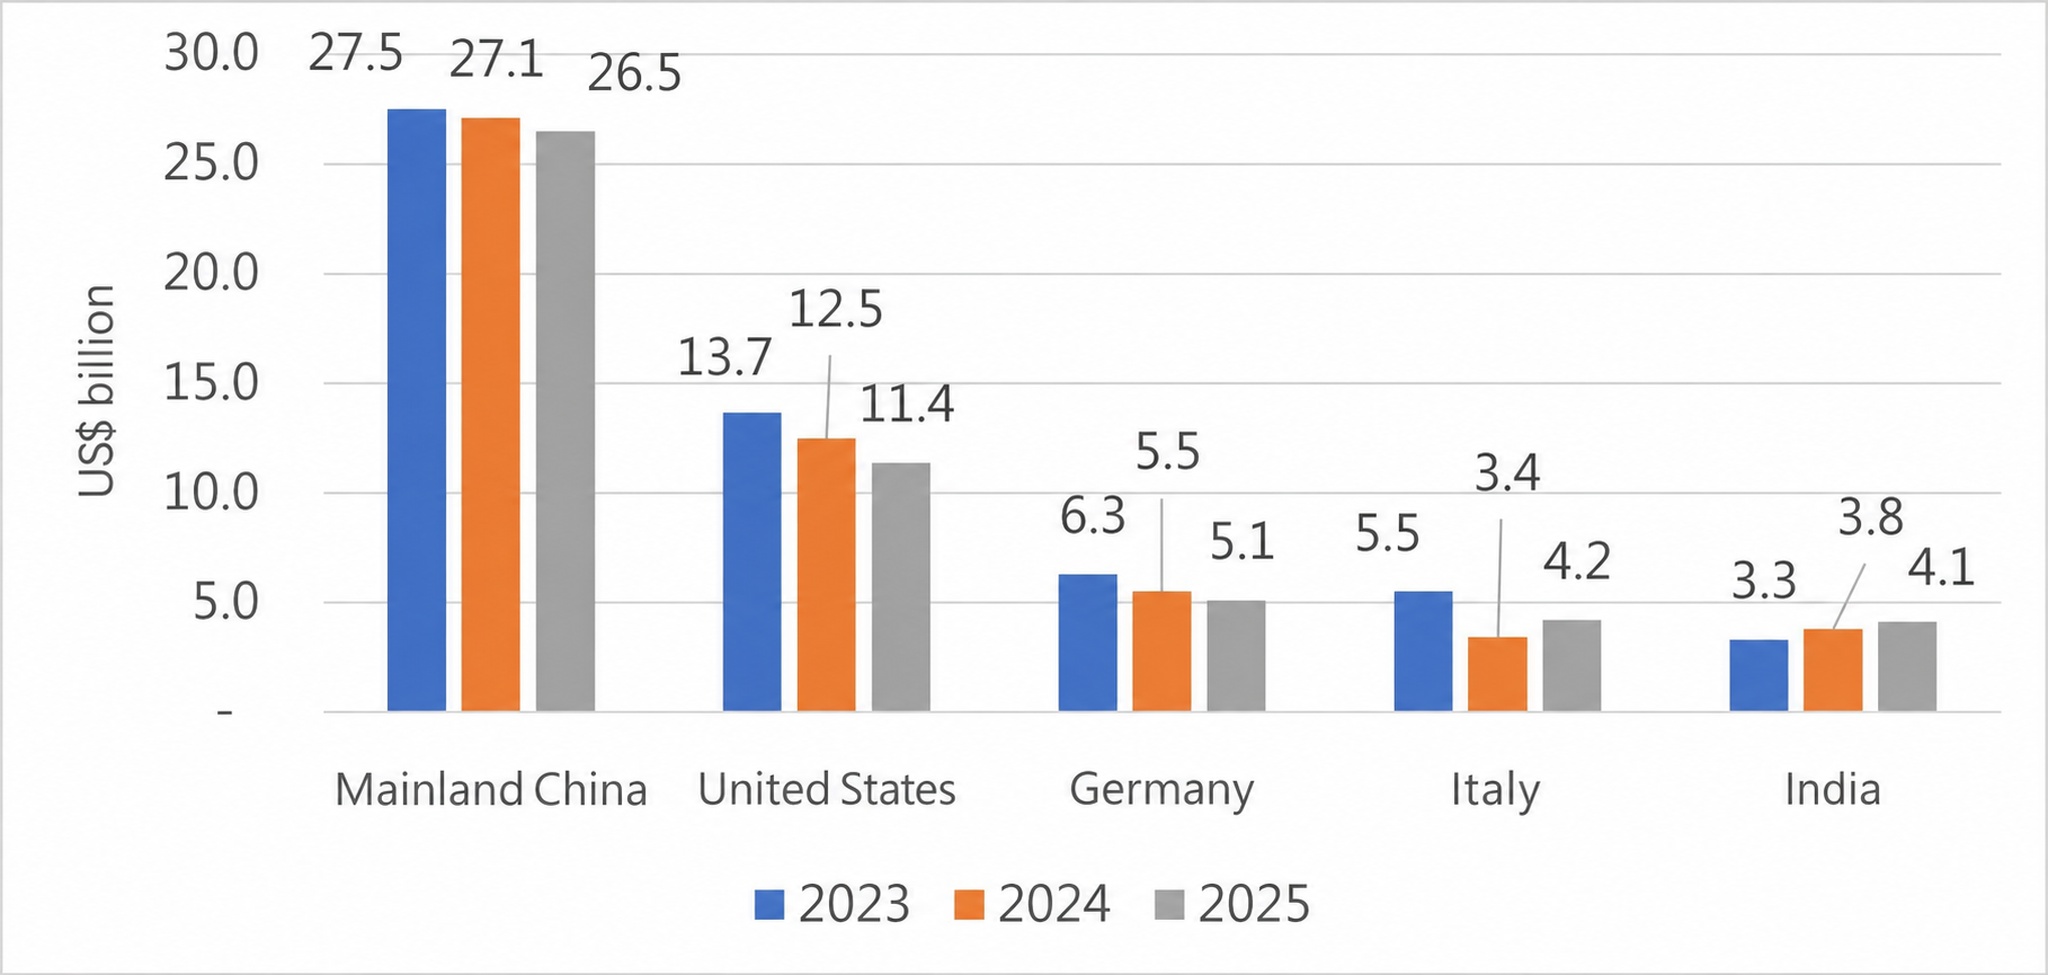
Changes in consumption were even more pronounced. Mainland China (US$26.5 billion) and the United States (US$11.4 billion) again led by a wide margin, together representing 46% of global consumption, followed by Germany (US$5.1 billion). Italy, up 24% to US$4.2 billion, rose to fourth; India (US$4.1 billion) ranked fifth, South Korea (US$3.1 billion) sixth, Japan (US$3.0 billion) seventh, Mexico (US$2.1 billion) eighth, Vietnam (US$1.8 billion) ninth, and Türkiye (US$1.8 billion) tenth. Canada, Thailand, and Taiwan, each at US$1.5 billion, followed in 11th through 13th place.
Only three of the ten largest consuming markets grew. Italy recorded the strongest increase at 24%, displaying a distinctive pattern: domestic production was essentially flat, exports fell 12%, and imports rose 16%. This indicates continued domestic reinvestment despite weaker overseas sales by local manufacturers. India grew 7%, while Vietnam expanded 35%.
Mexico’s consumption fell 23% to US$2.1 billion, yet the country remained eighth and was still the world’s fifth-largest machine tool importer. The pullback followed several years of exceptionally large capital-equipment purchases, although current consumption remains well above the range seen before 2021.
 |
Source: Gardner Publications Inc.(2026)
 |
Source: Gardner Publications Inc. (2026)
 |
Source: Gardner Publications Inc.(2026)
Global Machine Tool Imports and Exports in 2025
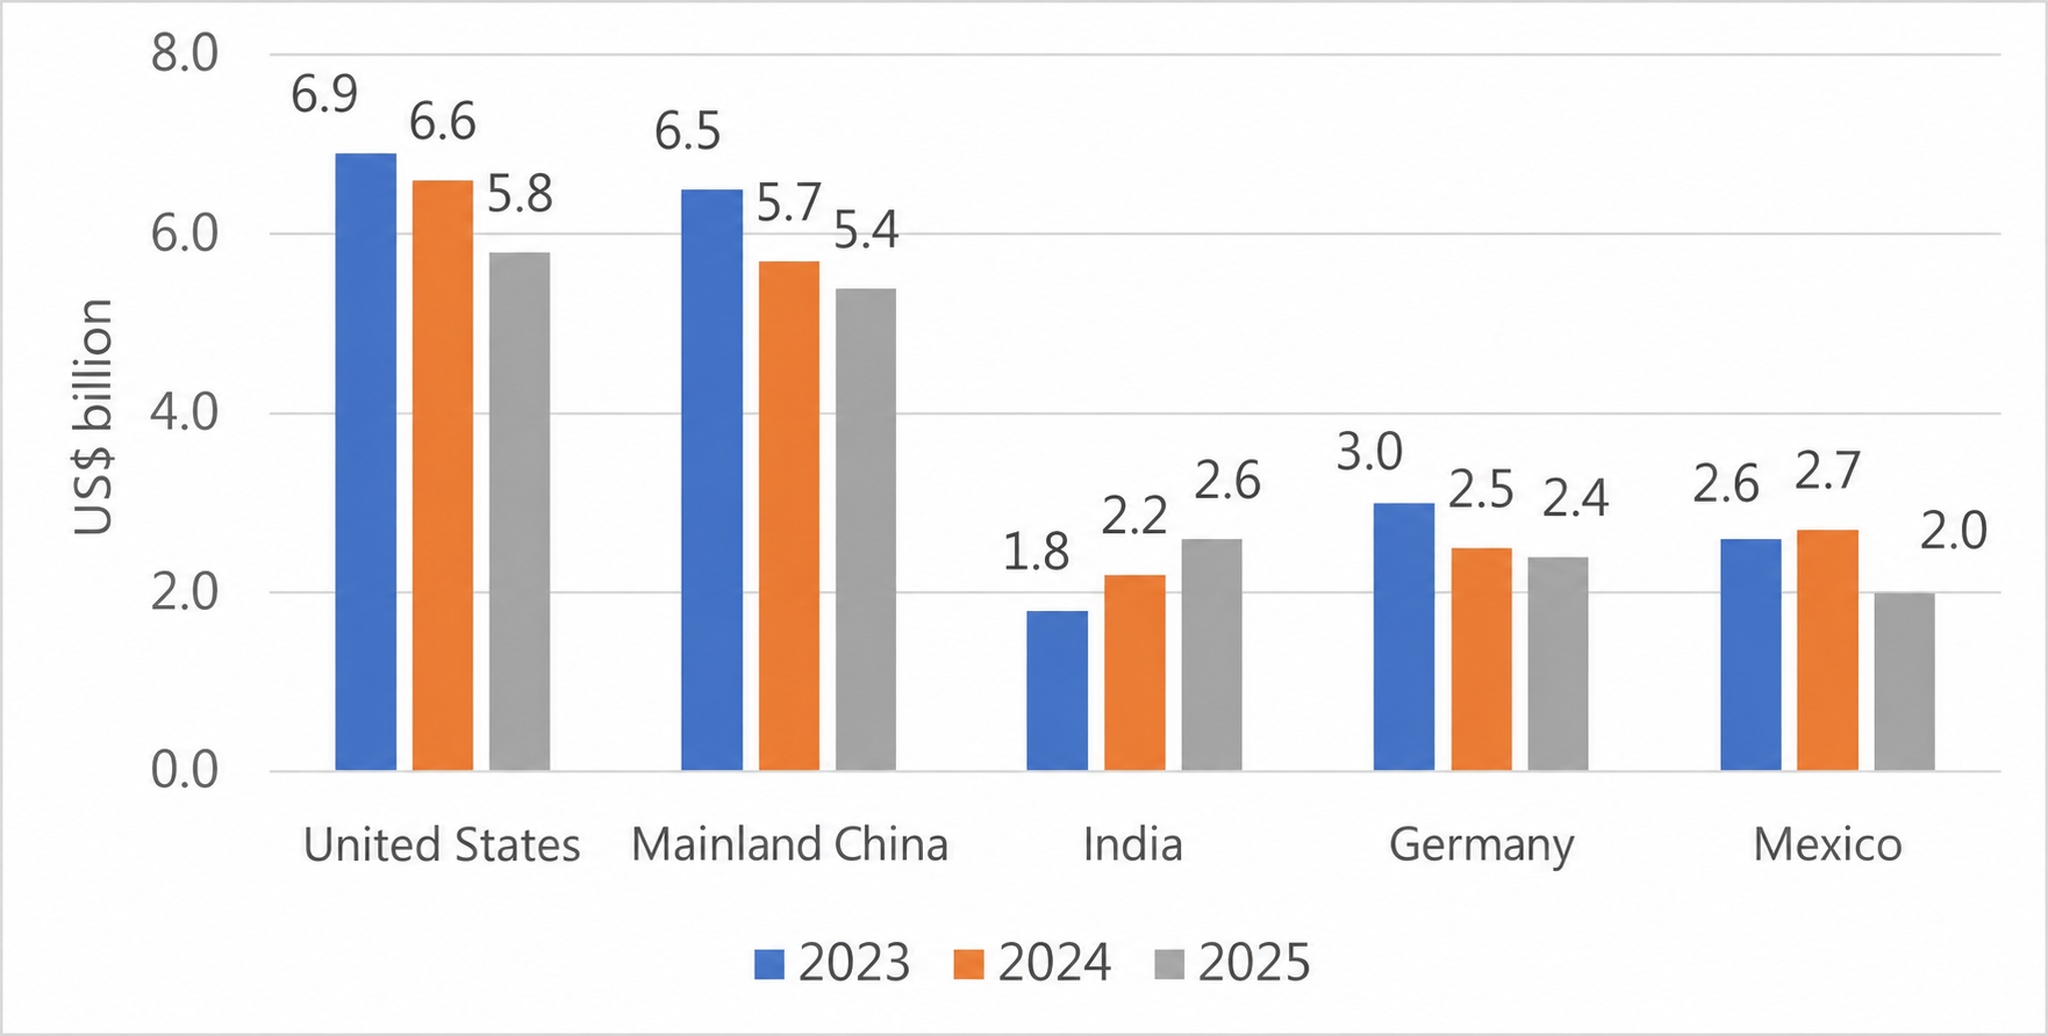
The United States (US$5.8 billion) and mainland China (US$5.4 billion) again ranked first and second in imports, followed by India (US$2.6 billion), Germany (US$2.4 billion), Mexico (US$2.0 billion), Vietnam (US$1.8 billion), Italy (US$1.6 billion), Türkiye (US$1.6 billion), Thailand (US$1.4 billion), and Russia (US$1.1 billion). Among these markets, imports grew in India (+17%), Vietnam (+34%), Italy (+16%), and Thailand (+35%); all others declined.
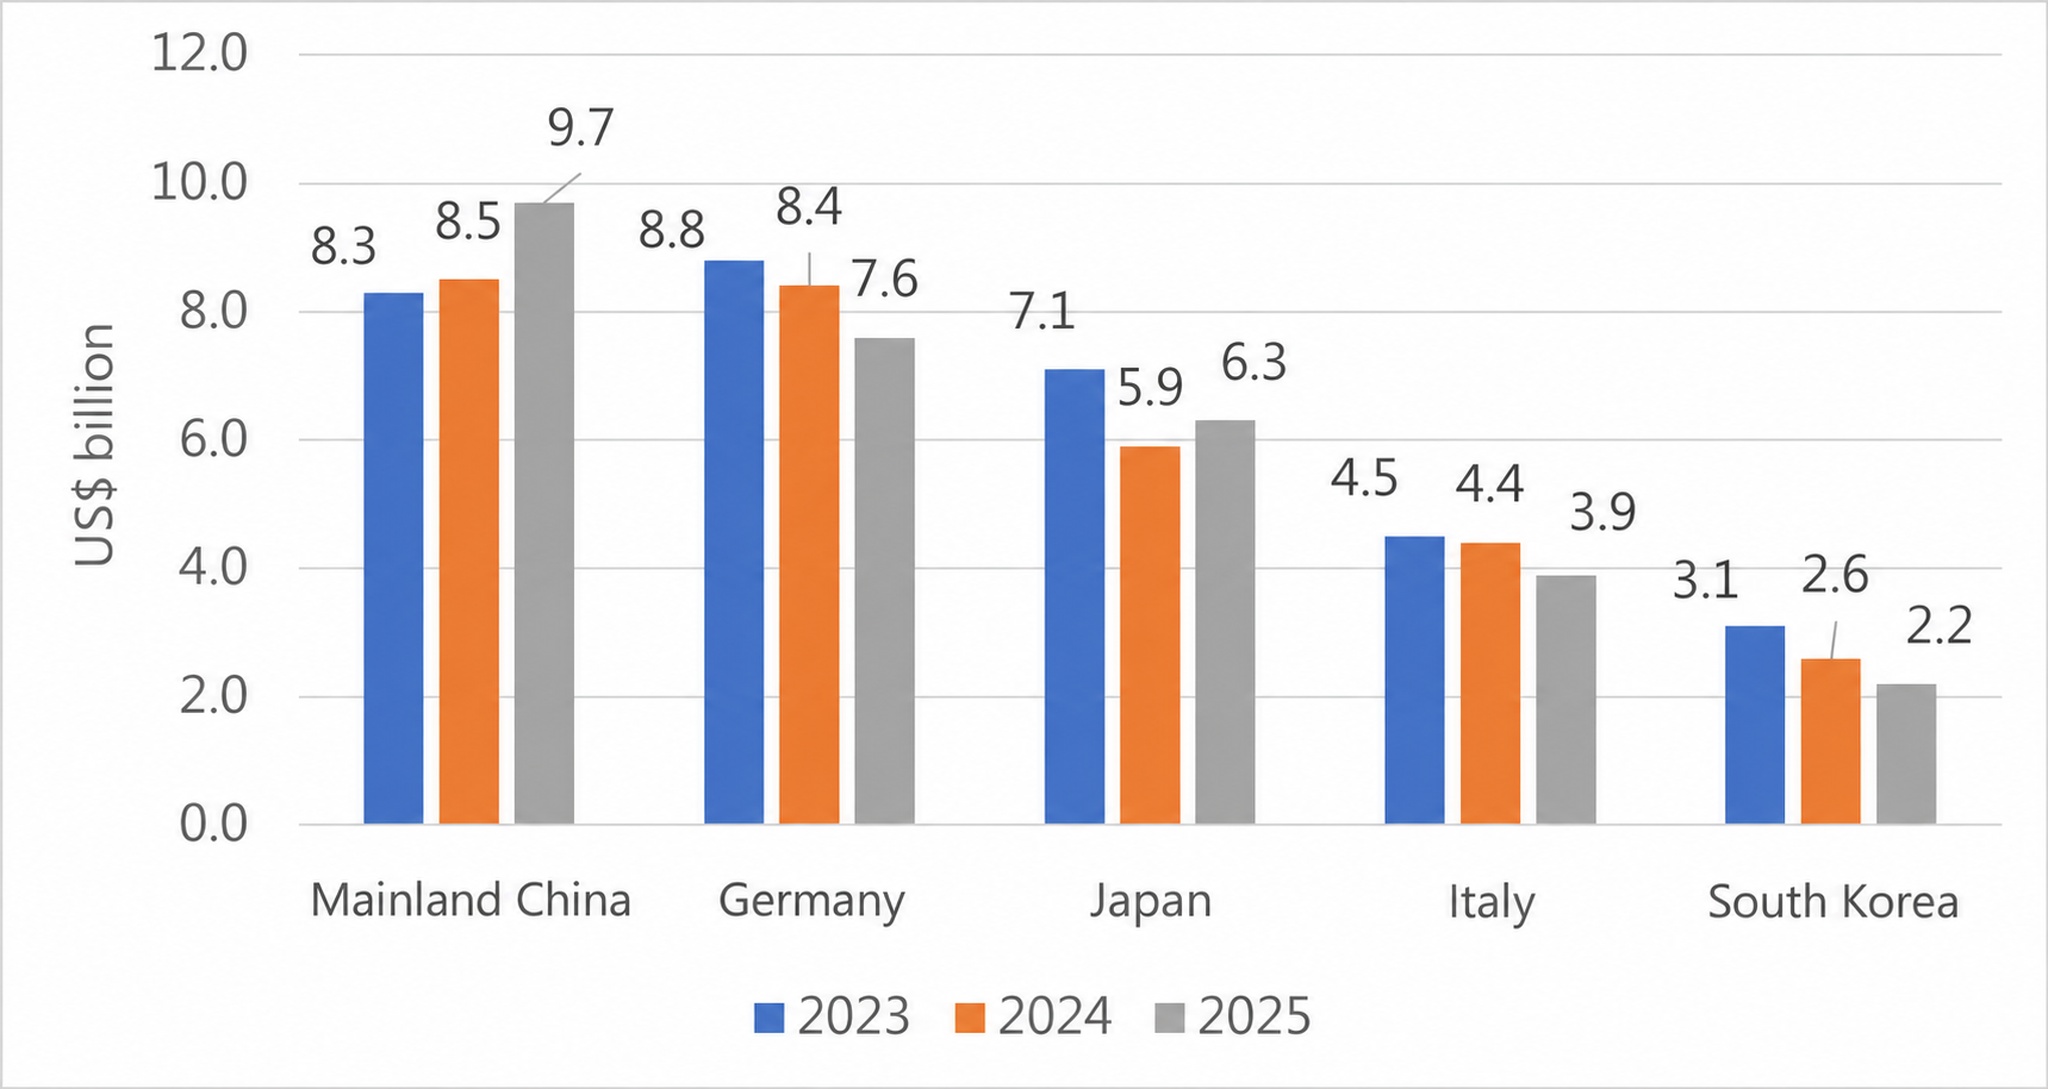
Export data revealed the year’s most notable trend. Mainland China’s exports rose 14% to US$9.7 billion, while Germany’s fell 10% to US$7.6 billion, further widening China’s lead. In just one year, mainland China’s share of global machine tool exports increased from about 18% to 21%. Growth was broad-based rather than concentrated in one product category: forging, stamping, bending, and shearing equipment rose 27%; broaching and wire-working equipment 25%; machining centers 17%; and EDM, laser, and waterjet equipment 9%.
Japan ranked third in machine tool exports at US$6.3 billion, up 7%, while Italy ranked fourth at US$3.9 billion, down 12%. They were followed by South Korea (US$2.2 billion), Taiwan (US$2.0 billion), Switzerland (US$2.0 billion), the United States (US$1.4 billion), Spain (US$1.3 billion), and Austria (US$0.95 billion). Austria entered the top ten, narrowly surpassing Belgium at US$0.94 billion.
Japan recorded the largest trade surplus in the survey at US$5.7 billion, slightly ahead of Germany (US$5.2 billion) and mainland China (US$4.3 billion). Italy (US$2.3 billion), Switzerland (US$1.4 billion), Taiwan (US$1.4 billion), and South Korea (US$1.3 billion) also maintained strong surpluses. The largest trade deficits were recorded by the United States (US$4.4 billion), India (US$2.3 billion), Mexico (US$1.9 billion), Vietnam (US$1.7 billion), and Russia (US$1.1 billion).
Overall, Southeast Asia was the growth engine of the global machine tool market in 2025. Combined consumption in Vietnam, Thailand, Malaysia, Indonesia, Singapore, and the Philippines rose 19% to US$4.9 billion, while the region’s imports also increased 19% to US$4.7 billion. Vietnam, Thailand, Malaysia, and Indonesia achieved growth across all four survey indicators—production, consumption, imports, and exports—and accounted for four of the five countries worldwide to do so. Vietnam’s imports of machining centers more than doubled, surging 120% to US$440 million and placing the country sixth globally in that category. Singapore and the Philippines were the regional exceptions, declining across all four indicators.
Europe presented a sharply different picture. Most of the 19 countries that declined across all four indicators were European, including Germany, Switzerland, Austria, Sweden, the United Kingdom, Hungary, Romania, Bulgaria, Slovenia, and Ukraine. Italy was a notable exception, while the Czech Republic (+23% in consumption), Poland (+7%), and Portugal (+6%) also achieved modest growth.
All three North American countries declined. Although the region’s combined consumption of US$15.0 billion still made it the world’s second-largest market after mainland China, consumption fell by 8% in the United States, 23% in Mexico, and 7% in Canada.
Taken together, the data depict a reshaping of the market rather than simple contraction. Production among the major exporters remained relatively resilient, and mainland China significantly strengthened its export position. Meanwhile, demand weakened across much of Europe and North America but accelerated in Southeast Asia. Whether Asia’s expansion remains limited to import-driven equipment installation or develops into local production warrants continued attention. For now, imports in Vietnam and Thailand remain approximately 30 times their domestic production.
 |
Source: Gardner Publications Inc.(2026)
 |
Source: Gardner Publications Inc.(2026)
 |
Source: Gardner Publications Inc.(2026)
Viewed through the structure of global production and consumption, Taiwan’s machine tool industry is at a critical turning point characterized by relatively stable rankings but rapidly changing competitive dynamics. Taiwan produced approximately US$2.8 billion in machine tools in 2025, ranking seventh globally, and exported about US$2.0 billion, ranking sixth, thereby retaining its position as a major global supplier. However, Taiwan’s production fell 12% year over year, substantially more than the global average decline of 3% and second only to Switzerland among major export-oriented countries. This highlights how Taiwan’s heavy dependence on external demand makes it especially vulnerable to cooling global capital-goods demand and changes in exchange rates and tariffs. By comparison, mainland China’s production reached US$30.8 billion, or 36% of the global total, while its exports rose 14% to US$9.7 billion and its global export share increased from about 18% to 21%. Competition has consequently expanded beyond scale and cost into mid- and high-end equipment and comprehensive product portfolios.
Taiwan’s Competitive Position, Challenges, and Potential Opportunities
The center of global demand is being redistributed. Mainland China and the United States remain the largest consuming markets, but emerging manufacturing bases such as India, Vietnam, and Thailand are expanding rapidly. In 2025, machine tool consumption in six major Southeast Asian countries grew 19%. Vietnam, Thailand, Malaysia, and Indonesia simultaneously recorded growth in production, consumption, imports, and exports, showing that supply-chain relocation is increasingly translating into actual equipment investment.
Taiwan’s real challenge is therefore not simply to preserve its sixth- or seventh-place global ranking, but to avoid being squeezed between mainland China’s scale and price competition and the advanced technology of Japan and Germany. Taiwan’s machine tool exports still fell 2.1% year over year from January through July 2026, while exports of key components grew 11.6%, revealing a structural divergence in which complete machines remain under pressure while components lead the recovery.
This also points to Taiwan’s next opportunity: shifting from complete-machine exports toward high-value-added manufacturing solutions. Taiwan can build on its strengths in precision components, customization, flexible manufacturing, and smart integration; accelerate upgrades in five-axis, high-speed and high-precision, multi-tasking, AI, and automation technologies; and enter high-growth applications such as semiconductors, liquid cooling for AI servers, aerospace, and new energy. In other words, Taiwan’s future competitive advantage should no longer rest on matching mainland China on value for money or undercutting Japan and Germany. Instead, it should create a differentiated value chain combining precision manufacturing, smart technologies, application solutions, and global service, elevating Taiwan’s machine tool companies from equipment suppliers to important partners in global manufacturing systems.
Strategic Recommendations for Taiwan’s Machine Tool Industry
Taiwanese machine tool companies should shift their international competitive strategy from the traditional emphasis on price, equipment specifications, and export scale toward market diversification, product upgrading, and integrated solutions. According to the Gardner 2026 World Machine Tool Survey, global demand weakened broadly in 2025, while India, Vietnam, and parts of Southeast Asia continued to grow. Companies should therefore adjust their market strategies to regional differences in demand rather than remain overly concentrated in traditional markets such as mainland China and the United States.
For market development, priority should be given to India, Vietnam, Thailand, and Malaysia, with selective expansion into Central and Eastern Europe and Latin America. Long-term customer relationships should be built through distributors, local maintenance, and technical service. Taiwan’s export performance in the first seven months of 2026—declining complete-machine exports but growing component exports—also shows that opportunities differ by product and market.
For product upgrading, companies should focus on five-axis machining, multi-tasking, high-precision control, smart sensing, digital twins, and AI-based process optimization, while integrating automation and complete production lines for applications in semiconductor equipment, aerospace, and liquid-cooling components for AI servers. The core strategy is to move from standalone machine sales to the integration of equipment, software, processes, and services. Modular design, strategic alliances, and overseas service networks can layer on additional value, while stronger energy efficiency, carbon management, and compliance with international regulations can reduce exposure to price competition and trade-policy changes and establish differentiated advantages that low-cost products cannot easily replace.


